

If you run a publisher site, you probably watch dashboards like a hawk. Then a weird thing happens: eCPM goes up, but total revenue does not. Or RPM looks healthy, but buyers say your CPMs are weak. This is the heart of RPM vs eCPM confusion.
Table of Contents
Both metrics matter, but they measure different layers of the same system.
- RPM is a page level outcome metric.
- eCPM is an impression level yield metric.
When you read them together, you can see whether your issue is demand, layout, or traffic quality.
The difference between these metrics is growing more visible, as well.
- Statista forecasts that global programmatic ad spend will exceed $700 billion by the end of 2026, creating competitive pressure and widening fluctuations in impression pricing.
- McKinsey points out that small changes in viewability and auction dynamics can lead to double digit percentage shifts in publisher revenue, even lows of up to 15%, particularly within automated ad environments.
In practice, publishers often look at one metric and miss what is actually broken. You might think demand dropped, when the real issue is fewer viewable impressions. Or you might chase higher CPMs, while total revenue keeps slipping. This article breaks down how RPM and eCPM work, why they diverge, and how to use both to spot problems faster and fix them with the right lever.
What Is RPM in Advertising?
What is RPM in advertising? RPM means Revenue per Mille, which is the revenue you earn per 1,000 page views. Page RPM is usually calculated like this:
RPM = (Revenue / Page views) × 1,000.
One detail causes reporting arguments: some dashboards calculate RPM per session, not per page view. A session based RPM can be useful for content planning, because it connects revenue to user journeys. If you compare a session RPM chart with an impression based eCPM chart, you will misread the story.
This is why RPM feels close to a business metric. It already includes everything that happened on the page: how many ads loaded, how many impressions sold, and what those impressions earned.
RPM depends on three big levers.
- First, ads per page. A page with two viewable ad slots has more chances to earn than a page with one small slot.
- Second, fill rate. This means if you send 10,000 ad requests and only 7,000 impressions are served, it gives a fill rate of 70%.
- Third, session depth and page view mix. If users read one page and leave, your total page views drop. Your RPM can also shift if you suddenly get more traffic to low value pages like tag archives, thin pages, or pages with poor viewability.
A simple way to remember it: RPM = demand * supply. It can be higher even if CPM falls, for example if you serve more ads per page or improve fill. It can also fall even when CPM rises, if users see fewer ads per visit.
What Is eCPM and How It Differs from RPM
eCPM stands for effective CPM. It turns any pricing model into revenue per 1,000 impressions, so you can actually compare apples to apples across deals, formats, and partners. Here is the way it’s often computed:
eCPM = (Revenue / Impressions served) × 1,000.
So the RPM and eCPM difference starts with the denominator. eCPM looks at impressions. RPM looks at page views. User behavior can change the relationship fast.
Here is a numbers example that shows why RPM differs from eCPM.
Scenario A: stable layout
This is 100K page views per month. You also earn 1.2 ad impressions served per page view of your pages, so you serve 120,000 impressions. Your average eCPM is $6.
Revenue = 120,000 / 1,000 × $6 = $720.
RPM = $720 / 100,000 × 1,000 = $7.20.
eCPM = $6 by definition.
Scenario B: same eCPM, fewer ads per page
You have a 100,000 page views. A layout algorithm change drops impressions served per page view from 1 to 0.5, so you now serve instead 50,000 impressions. Your eCPM stays $6.
Revenue = 50,000 / 1,000 × $6 = $300.
RPM = $300 / 100,000 × 1,000 = $3.00.
eCPM stays $6.
This is the traditional case of a high eCPM giving us a low RPM. The user viewed fewer ads, earning you less per page view. For eCPM vs RPM for publishers, this matters because your business pays bills with total revenue, not with a single yield metric.
Scenario C: lower eCPM, higher RPM
You have 100,000 page views. You get 2.0 impressions per page view, so 200,000 impressions delivered. Your eCPM is only $4.
Revenue = 200,000 / 1,000 × $4 = $800.
RPM = $800 / 100,000 × 1,000 = $8.00.
Here eCPM, although lower, means RPM is higher since you are monetizing more of the page view. This is a perfect example of why you should never optimize for one metric alone.
| Metric | What It Measures | Formula | Best Use Case | Common Mistake |
| RPM | Revenue per 1,000 page views | (Revenue / Page views) × 1,000 | Evaluate overall page monetization performance | Assuming high RPM means strong demand, even when it comes from more ads per page |
| eCPM | Revenue per 1,000 impressions | (Revenue / Impressions) × 1,000 | Evaluate demand quality and pricing per impression | Focusing only on eCPM while ignoring fill rate or impression volume |
| RPM + eCPM Together | Full monetization picture | Compare both metrics side by side | Identify whether issues come from demand or supply | Optimizing one metric in isolation |
Reddit Case: Publishers Confused About RPM vs eCPM
A way to better visualize this confusion in the wild, is people that ask why CPM and RPM numbers don’t match. One creator in a Reddit thread wanted to know why there was such an enormous gap between CPM and RPM, assuming RPM ought be approximately 55% of CPM. Commenters challenged that and said the ratio can be much lower because not all views serve ads, ad blockers exist and ad formats pay differently.
Even though that thread is about YouTube, the logic maps to sites. Not every page view becomes a paid impression. Some impressions are blocked. Some are not viewable. Some users never scroll to the slot.
Google explains a similar idea in its own analytics help: RPM is based on views and includes non monetized views, while CPM is advertiser cost per 1,000 ad impressions.
For publishers, replace “views” with “page views.” The gap between page views and monetized impressions is where money disappears.
Why the RPM vs eCPM Gap Matters for Publishers
If you only chase eCPM, you can still lose money. That happens when you raise floors too far, increase timeouts, or cut the number of viewable impressions. eCPM can look better because the impressions that remain are higher priced. Meanwhile, RPM drops because you served fewer paid impressions per page view.
This is why ad ops teams need to treat these as publisher revenue metrics, not as isolated dials. A smart dashboard shows both trends side by side, plus the drivers behind them.
Here are common bad decisions that come from reading the wrong signal.
- Mistake 1: Raising floors to “fix” low eCPM without watching fill. If fill drops 15%, your total revenue can drop even if eCPM rises.
- Mistake 2: Optimizing for RPM by adding more slots that are not viewable. This can raise ad requests but not revenue, and it can also hurt user behavior. Then both metrics fall later.
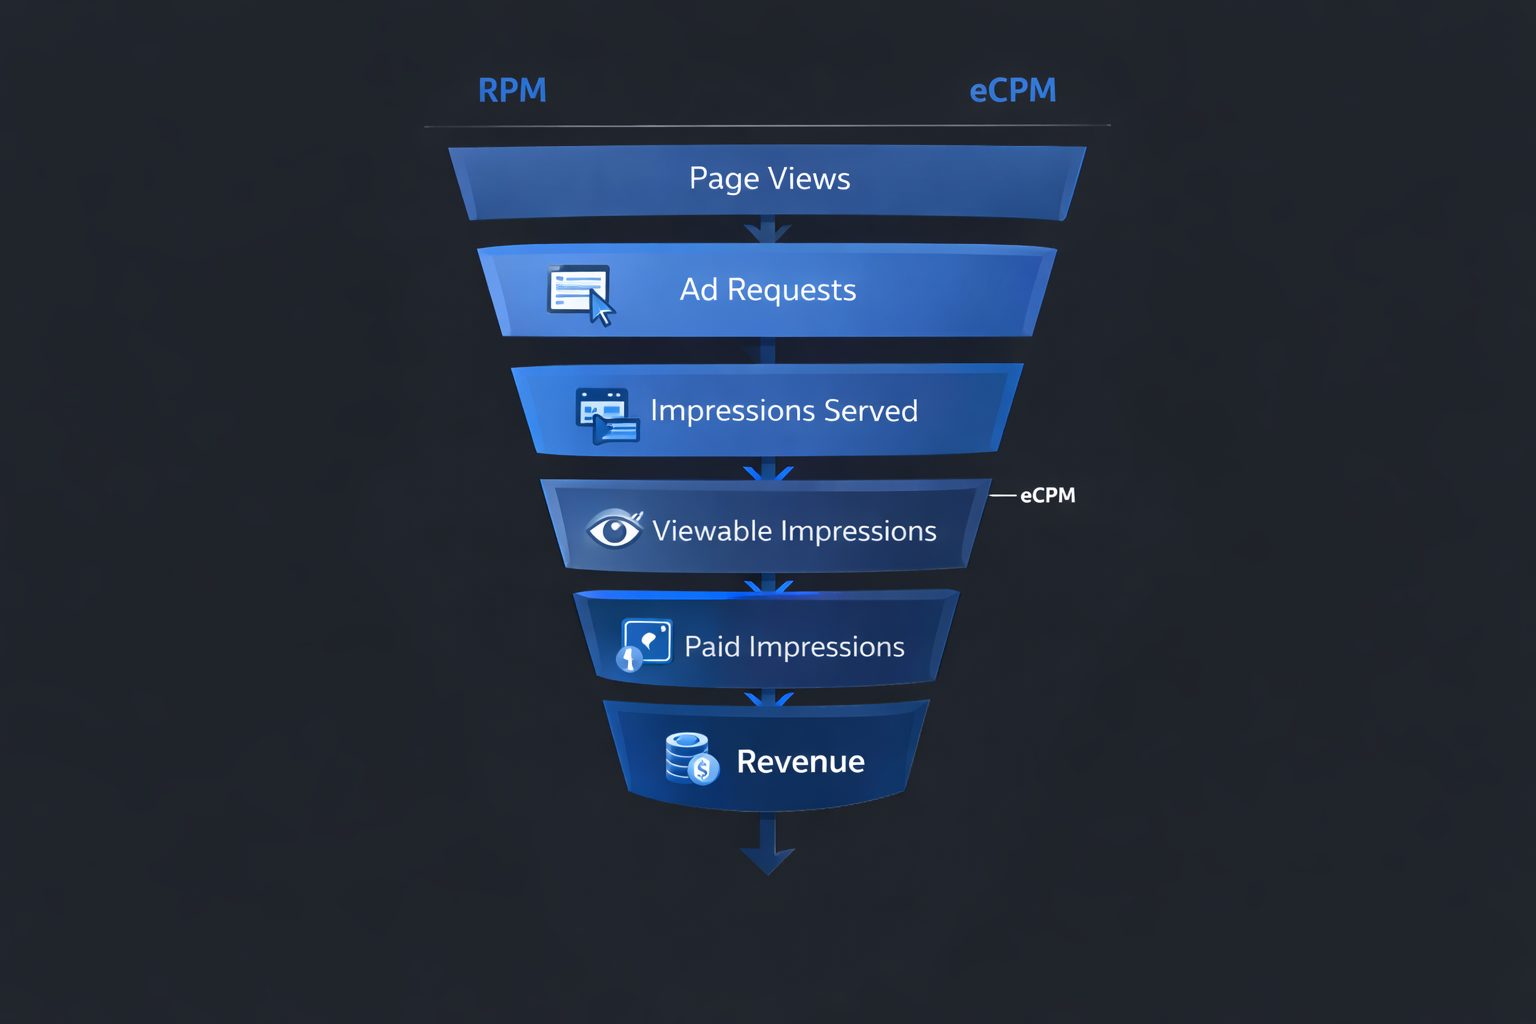
If you are trying to explain the gap between RPM and eCPM to a business team, use the page view funnel: page view to ad request to served impression to viewable impression to paid impression to revenue.
Each step has leakage, and each step has different owners.
How to Use Both Metrics to Optimize Revenue
Start by tracking RPM and eCPM daily, not weekly. Add four supporting drivers: impressions served per page view, fill rate, viewability, and traffic mix by page type. This is enough to diagnose most revenue swings.
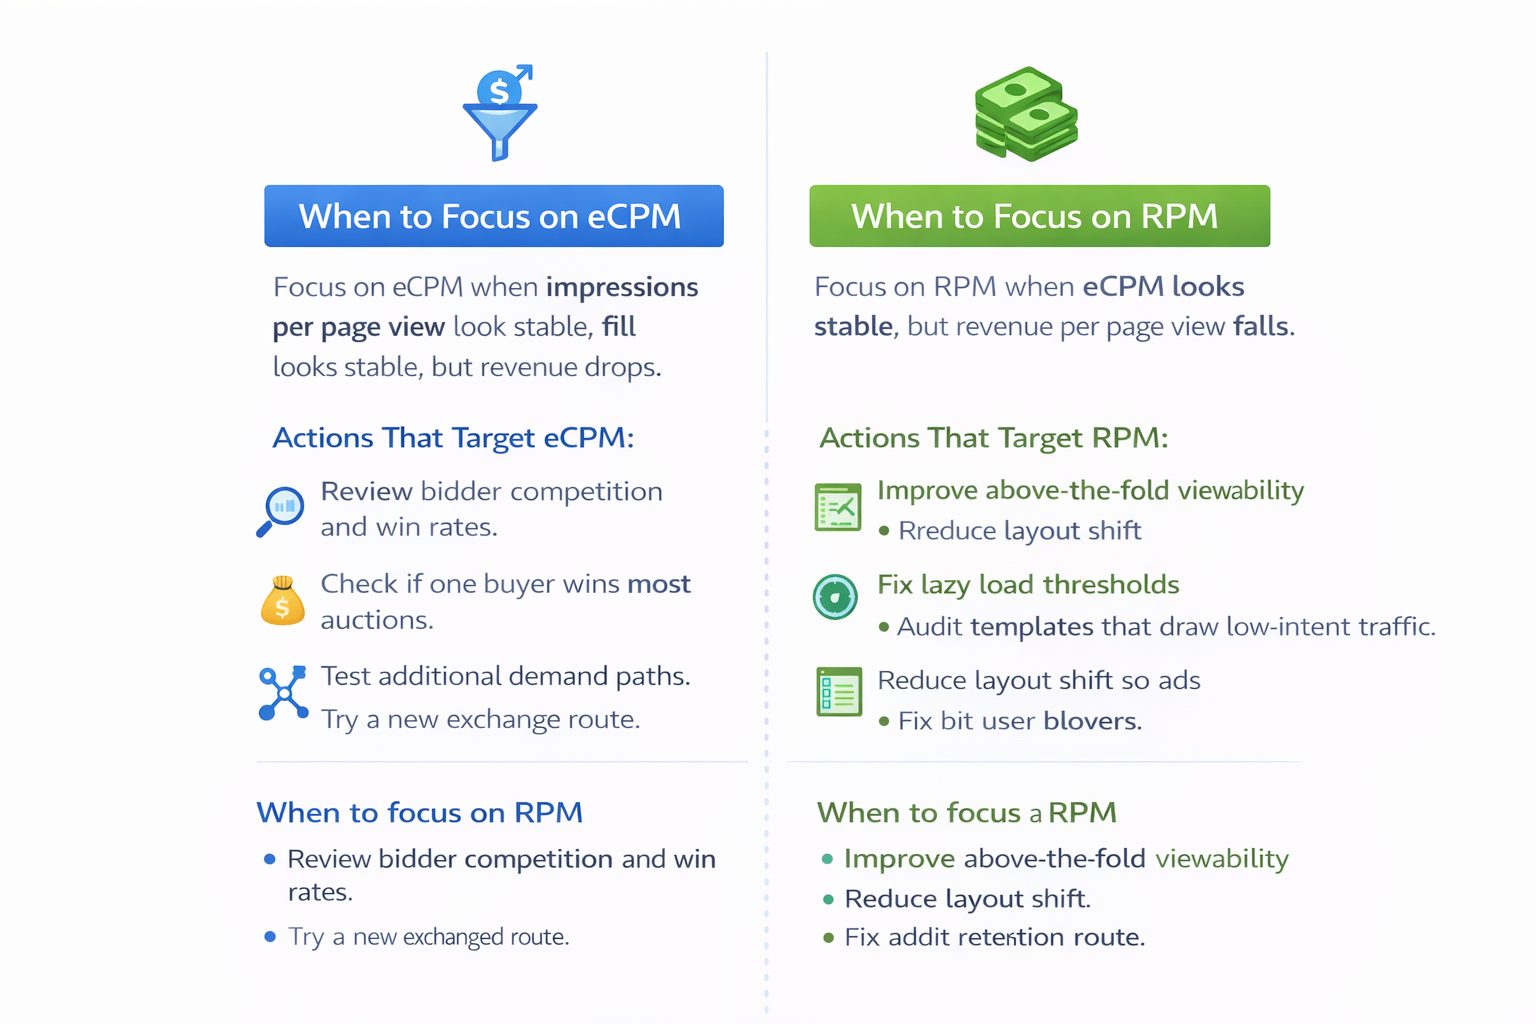
When to focus on eCPM
Focus on eCPM when you see stable impressions per page view, stable fill, and stable traffic, but revenue falls. That usually points to demand weakness, or a partner mix issue.
Actions that target eCPM:
- Review bidder competition and win rates.
- Check if one buyer wins most auctions.
- Test additional demand paths through a managed partner, or a new exchange route.
If you run your own stack, BidsCube SSP can help you manage supply and demand routing across partners. If you need more buyer diversity, BidsCube DSP can add demand side options. If you want to centralize auctions and reporting, a white label exchange can be an option .
When to focus on RPM
Focus on RPM when eCPM looks stable, but revenue per page view falls. That usually points to layout, viewability, or user behavior.
Actions that target RPM:
- Improve above the fold viewability for one key unit.
- Reduce layout shift so ads render in stable slots.
- Fix lazy load thresholds so the slot loads before the user leaves.
- Audit page templates that attract low intent traffic.
Run A/B tests on one template at a time. Keep the control group stable. Watch scroll depth and time on page, since aggressive ads can lower both. A small RPM lift is not worth long-term traffic loss.
This is ad inventory optimization in practice. You adjust how much inventory you produce and how much of it is actually seen, not only what each impression earns.
Dashboard recommendations
A simple publisher dashboard should include:
- Page RPM by section and device.
- eCPM by format and buyer group.
- Impressions per page view, plus fill.
- Viewability and time in view for top units.
- Revenue per session for key landing pages.
Then add annotations for major changes: layout updates, floor changes, consent changes, and traffic spikes.
If you want validation on partner quality and support, review platforms that collect feedback. Here are BidsCube reviews on G2 and Clutch.
A quick troubleshooting matrix
Use this simple matrix when revenue swings in one week. It helps you decide which knob to turn first.
- If eCPM drops and impressions per page view are flat, demand is weaker. Check buyer competition, viewability penalties, brand safety blocks, and geo mix.
- If eCPM is flat but RPM drops, supply side output changed. Look for fewer impressions per page view, a drop in fill, or a template change that reduced viewability.
- If both eCPM and RPM drop, start with traffic mix and technical delivery. A spike in low value traffic, slow pages, or broken slots can pull both metrics down at once.
- If both eCPM and RPM rise, confirm it is real. Make sure the change did not come from reporting delays, invalid traffic filtering, or a one time direct deal.
Finally, remember that programmatic advertising is an auction. The “best” setup depends on your traffic, your formats, and your buyers.
Conclusion
Both RPM and eCPM have their merits, but they serve distinct queries. RPM reveals how well you monetize page views. eCPM lets you know how much each impression is worth. To illustrate the impact in simple terms, you break down the funnel into stages and measure leakage.
Use both measures and you can figure out the true reason quickly. Your output will give you where the leak starts if the dashboard looks confusing, write down the RPM vs eCPM funnel and check where the leak starts.
FAQ
What is the difference between RPM and eCPM for publishers?
The RPM and eCPM difference is the denominator. RPM measures revenue per 1,000 page views, while eCPM measures revenue per 1,000 impressions served. That is why RPM differs from eCPM when ads per page, fill rate, or viewability changes.
Which metric matters more: RPM or eCPM?
For eCPM vs RPM for publishers, RPM is the better top line metric as it scales to revenue per page view. Again, eCPM is the better yield metric because it shows what an advertiser pays for each impression. Use both, and monitor trends over time in order to not chase a number that seems appealing yet earns less.