

Why your CPM increases while RPM falls: learn the real difference, formulas, and practical ways to use both metrics to improve yield, fill rate, and monetization stability in 2026.
Table of Contents
- What Is CPM Cost per Mille (CPM)?
- What Is RPM (Revenue per Mille)?
- Difference Between CPM and RPM
- CPM vs RPM Comparison Table
- Which Metric Reflects “True Performance”?
- Expert Insight
- The Reddit Case
- Calculation Examples
- What Actually Drives RPM
- RPM vs CPM in Decision-Making
- How BidsCube Helps You Measure What Matters
- Conclusion
- FAQ
The problem becomes evident when you observe a high CPM value which appears with a low RPM reading during the same reporting period. In this guide, our top experts achieve the following:
- break down cost per mille and revenue per mille;
- show the formulas;
- explain how to use both metrics in real decisions.
The key idea is simple. CPM describes what buyers pay for exposure. RPM is the amount you actually earn per thousand units of traffic. That gap exists for good reasons, and you can measure it.
What Is CPM Cost per Mille (CPM)?
CPM stands for cost per 1,000 ad impressions. Buyers use it to price reach. Many platforms also show variations like “viewable CPM” or “playback-based CPM” to account for whether the ad actually showed on screen.
Use Cases
CPM helps when your goal is exposure at scale. Typical use cases include:
- Brand awareness campaigns
- Prospecting across broad audiences
- Comparing demand strength across GEOs
- Evaluating premium placements (above-the-fold, video, CTV)
If you monetize inventory, CPM also helps you estimate how “valuable” your traffic looks to buyers, even before you look at revenue.
Check how your sell-side setup affects yield on a Supply-Side Platform (SSP)
Formula
CPM is a pricing metric based on impressions:
CPM = (Total Cost / Total Impressions) × 1,000
Example: If an advertiser spent $500 for 200,000 impressions:
CPM = (500 / 200,000) × 1,000 = $2.50
What Is RPM (Revenue per Mille)?
RPM stands for revenue per 1,000 units of traffic. The “unit” depends on the platform and report type. In publishing, you often see:
- Page RPM (per 1,000 pageviews)
- Impression RPM (per 1,000 impressions)
- Request RPM (per 1,000 ad requests)
On YouTube, RPM includes total creator revenue per 1,000 views after revenue share, and it can include revenue sources beyond ads.
Use Cases
RPM is the publisher-side “reality check.” It helps you:
- Track the revenue impact of layout, speed, and ad density changes.
- Compare monetization quality across segments (GEO, device, format).
- Separate “traffic growth” from “revenue growth.”
- Validate whether optimizations actually pay off.
If you also buy media and need a clean view of cost drivers, review the Demand-Side Platform (DSP)
Formula
The generic RPM formula is:
RPM = (Total Revenue / Total Units) × 1,000
Where “units” could be pageviews, impressions, requests, or views.
Example (Page RPM): If you earned $900 from 300,000 pageviews:
RPM = (900 / 300,000) × 1,000 = $3.00
Difference Between CPM and RPM
CPM and RPM often look like they should match, but they do not, because:
- They can use different denominators (impressions, pageviews, or requests).
- RPM reflects what you keep, not what buyers pay (fees, rev-share, and leakage matter).
- Not every pageview produces a paid impression (ad blockers, no-fill, policy limits, latency timeouts).
When teams ask for the difference between RPM and CPM, they usually want to know why one number rises while the other falls. The answer lives in the layers between “request” and “cash.”
CPM vs RPM Comparison Table
| Feature | DSP | SSP |
| Primary User | Advertisers & agencies | Publishers & media owners |
| Core Goal | Buy targeted impressions at the best possible price | Sell inventory at the highest sustainable yield |
| Data Focus | Audience segments, conversion events, LTV models | Page context, viewability scores, floor prices |
| Key Metric | CPA / ROAS | eCPM / Fill Rate |
| Auction Role | Bidder: submits offers in sub-100 ms | Seller: accepts the highest qualified bid |
You can think of it as revenue per mille and cost per mille describing two sides of the same chain.
Which Metric Reflects “True Performance”?
There is no single winner. “True performance” depends on the question. Use CPM when you ask:
- How strong is the demand for this audience and placement?
- Do buyers value this GEO, device, and format mix?
- Are floors too high for current market conditions?
Use RPM when you ask:
- How much revenue did we actually generate from the traffic we received?
- Did the layout, latency, and auction setup turn demand into cash?
- Did we trade yield for user experience, or vice versa?
In practice, CPM along with RPM works best as a pair:
- CPM tells you “market price signals.”
- RPM tells you “business outcome.”
Want more direct control of how supply meets demand? Review BidsCube White-Label AdExchange
Expert Insight
Roman Vasyukov, CEO and Founder of BidsCube, shared the perspective below based on his work with programmatic teams and white-label infrastructure. He sees the same pattern across tools: automation works only when teams set clear rules and measurements first.
Great programmatic partners do more than provide technology. They help you connect the dots between data, creative, and business outcomes.
Why this matters: CPM can look “good” while RPM stays flat if the setup leaks value. You need both views to see the full chain.
The Reddit Case
YouTube users can view RPM data which shows creator earnings from 1,000 views after YouTube takes its share of revenue while showing all possible revenue streams. Main themes from the comments:
- RPM accounts for platform revenue share, while CPM does not.
- Not every view becomes a monetized playback. The combination of ad blockers and restricted ads in particular areas and insufficient viewer interest leads to decreased monetized video views which subsequently lowers RPM.
- The implementation of mid-rolls as new ad opportunities will boost RPM because it generates more paid video views without changing the CPM rate.
- Extra revenue sources can raise RPM without changing CPM, because CPM focuses on ads, but RPM can include other revenue streams in some environments.
One commenter also pointed out the “monetized share” problem: total views (or pageviews) often exceed monetized events, and that gap directly hits RPM.
Calculation Examples
CPM as well as RPM show identical numerical values but they monitor different performance metrics which result in opposite changes between their values. CPM operates through advertiser spending and ad display frequency but RPM operates through publisher earnings and page view numbers. If you compare them in a spreadsheet, make sure your numbers are correct, or you will get the wrong results. Below are 3 practical examples you can reuse in spreadsheets when comparing RPM and CPM.
Example 1: CPM From Advertiser Spend
- Spend: $1,200
- Impressions: 400,000
CPM = (1,200 / 400,000) × 1,000 = $3.00
Example 2: Page RPM From Publisher Revenue
- Revenue: $850
- Pageviews: 500,000
RPM = (850 / 500,000) × 1,000 = $1.70
Example 3: CPM Rises, RPM Falls
Assume this month vs last month:
- CPM: $4.00 → $5.00 (buyers pay more per 1,000 impressions)
- Fill rate drops because floors are too aggressive: 80% → 55%
- Pageviews stay at 1,000,000
- Ad slots per pageview: 2
Last month impressions = 1,000,000 × 2 × 0.80 = 1,600,000
This month impressions = 1,000,000 × 2 × 0.55 = 1,100,000
If net revenue per impression tracks CPM proportionally, revenue can still drop because you sold fewer impressions. This is the classic gap in comparing CPM and RPM.
What Actually Drives RPM
RPM moves when any part of the chain changes: traffic quality, auction dynamics, or what happens after the bid.
1) Demand And Pricing
This segment covers forces outside the publisher’s site that still move RPM and CPM. When buyers change where, when, and what they buy, pricing shifts fast.
- GEO mix shifts (high-value vs low-value regions)
- Seasonality (Q4 often looks different than Q1)
- Buyer competition by format (video vs display vs native)
Track these signals first when numbers swing without obvious site changes. Demand changes can raise CPM in one region or format while dragging blended revenue down.
2) Monetizable Supply
Supply is not just traffic volume. It is how much of that traffic can actually sell at acceptable quality and policy levels.
- Viewability and placement quality
- Ad density (how many opportunities you offer per session)
- Policy, brand safety, and content limits
Improve supply quality before adding more slots. Better viewability, cleaner placements, and sensible ad density usually lift revenue with fewer side effects.
3) Auction And Tech Setup
This segment covers the mechanics that decide who wins the impression, and at what price. Small config changes can move fill rate and revenue more than creative changes.
- Floors (static vs dynamic)
- Timeout settings, and page speed
- Header bidding configuration
- Identity match rate and user sync (where applicable)
Recheck floors, timeouts, and header bidding logic when CPM along with RPM diverge. Tech settings often cause “good demand, bad yield” scenarios.
4) Leakage And Cost Layers
Even when demand is strong, money can leak through fees, filtering, and reporting mismatches. These layers can hide the real reason revenue drops.
- Platform fees, rev-share, and intermediaries
- Invalid traffic filtering and clawbacks
- Discrepancies between ad server, SSP, and analytics
Check your costs and any differences in your numbers regularly, not just when something goes wrong. Fixing money that slips through the cracks often brings in more revenue quickly because you do not need more visitors or higher ad prices.
Simple Flowchart: Where RPM Gets Won Or Lost
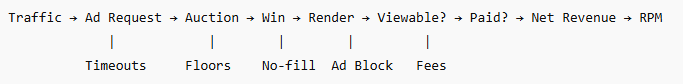
RPM vs CPM in Decision-Making
Teams often argue RPM vs CPM when they should split responsibilities.
For Publishers And Media Owners
Use CPM to manage market signals:
- Set floors, then watch bid rate and win rate
- Compare CPM trends by GEO, device, and format
- Identify buyers paying premium prices
Use RPM to manage business outcomes:
- Track revenue per session or per 1,000 pageviews
- Validate layout and refresh rules
- Catch monetization regressions after releases
This is where RPM and CPM become a control system, not a scoreboard.
For Advertisers And Agencies
If you buy media, CPM is only the first step. Pair it with:
- CPA / ROAS
- Frequency and reach
- Viewability and fraud rate
If you also own supply (owned media, apps, CTV), RPM tells you what your traffic returns.
How BidsCube Helps You Measure What Matters
“Better measurement” means faster answers with fewer blind spots. BidsCube positions this around real-time reporting, custom reports, and system-level visibility across programmatic components.
Here are practical ways it supports CPM with RPM work:
Real-Time Data And Reporting
BidsCube materials describe real-time reporting and data access for monitoring performance without waiting for delayed reports.
Custom Reports, Filtering, And API Stats
The white-label AdExchange presentation mentions custom reports, filtering, and an “API Statistics” option to push stats and compare numbers to reduce discrepancies.
Troubleshooting And Bidstream Visibility
Documentation also mentions tools like an issues inspector and bidstream data access, which help when RPM drops, but CPM does not explain why.
Where To Start Inside The Stack
Start with the part of the stack that matches the business problem. Yield issues usually live on the sell-side, while efficiency issues typically live on the buy-side. The quick map below points to the right entry point.
- If your main problem is publisher yield, start on the sell-side: BidsCube SSP
- If your main problem is buying efficiency, start on the buy-side: BidsCube DSP
- If you need a marketplace layer for routing and direct trading, review: White-Label AdExchange
- For third-party feedback during vendor checks, you can review BidsCube on Clutch and read G2 reviews for BidsCube White-Label AdExchange.
Pick one starting point, stabilize the core workflows, and then add layers as needed. Use third-party reviews during vendor checks, but let requirements and day-to-day operations drive the decision.
Our tech staff and AdOps are formed by the best AdTech and MarTech industry specialists with 10+ years of proven track record!

Conclusion
CPM tells you what the market is willing to pay. RPM tells you what you actually earned. They do not match 1:1 because they measure different parts of the chain. The gap is not noise. It is where most monetization work lives.
FAQ
Why Does CPM Rise While RPM Falls?
Usually, you sold fewer paid impressions per unit of traffic. Common causes include higher floors, more no-fill, slower pages, more ad blocking, or shifts to lower-value GEO and device mixes. YouTube also notes RPM consists of all views, including unmonetized ones, which can pull it down even when CPM looks healthy.
Which RPM Should I Track (Page, Impression, or Request)?
The decision requires tracking of page RPM for layout and UX and content selection decisions but impression RPM should be used for ad density and viewability optimization and request RPM for auction system maintenance of timeouts and header bidding performance.
When Should I Raise Floors vs Lower Them?
Raise floors when bid density stays strong, and you see minimal impact on fill and win rate. Lower floors when fill collapses, or when RPM drops even though CPM looks fine. Floors should follow demand, not ego.
Is My RPM Drop Demand-Driven or Setup-Driven?
The system requires immediate assessment to identify the cause of the problem: The CPM values from all campaigns have decreased which shows that market demand has shifted. The system performance deteriorates when CPM values stay constant because both fill rate and win rate metrics decrease due to setup issues. Your ad performance will decrease when CPM values remain stable but your ads become less visible to viewers.
How Do I Compare CPM/RPM Across GEO, Device, and Format?
The analysis requires using identical slice sizes because this approach maintains truthful comparison results: The analysis should divide its data into three geographic segments which include the top 5 markets and the long tail and restricted access markets. The analysis should divide its data into four segments which include desktop users and mobile web users and in-app users and CTV users.